client need
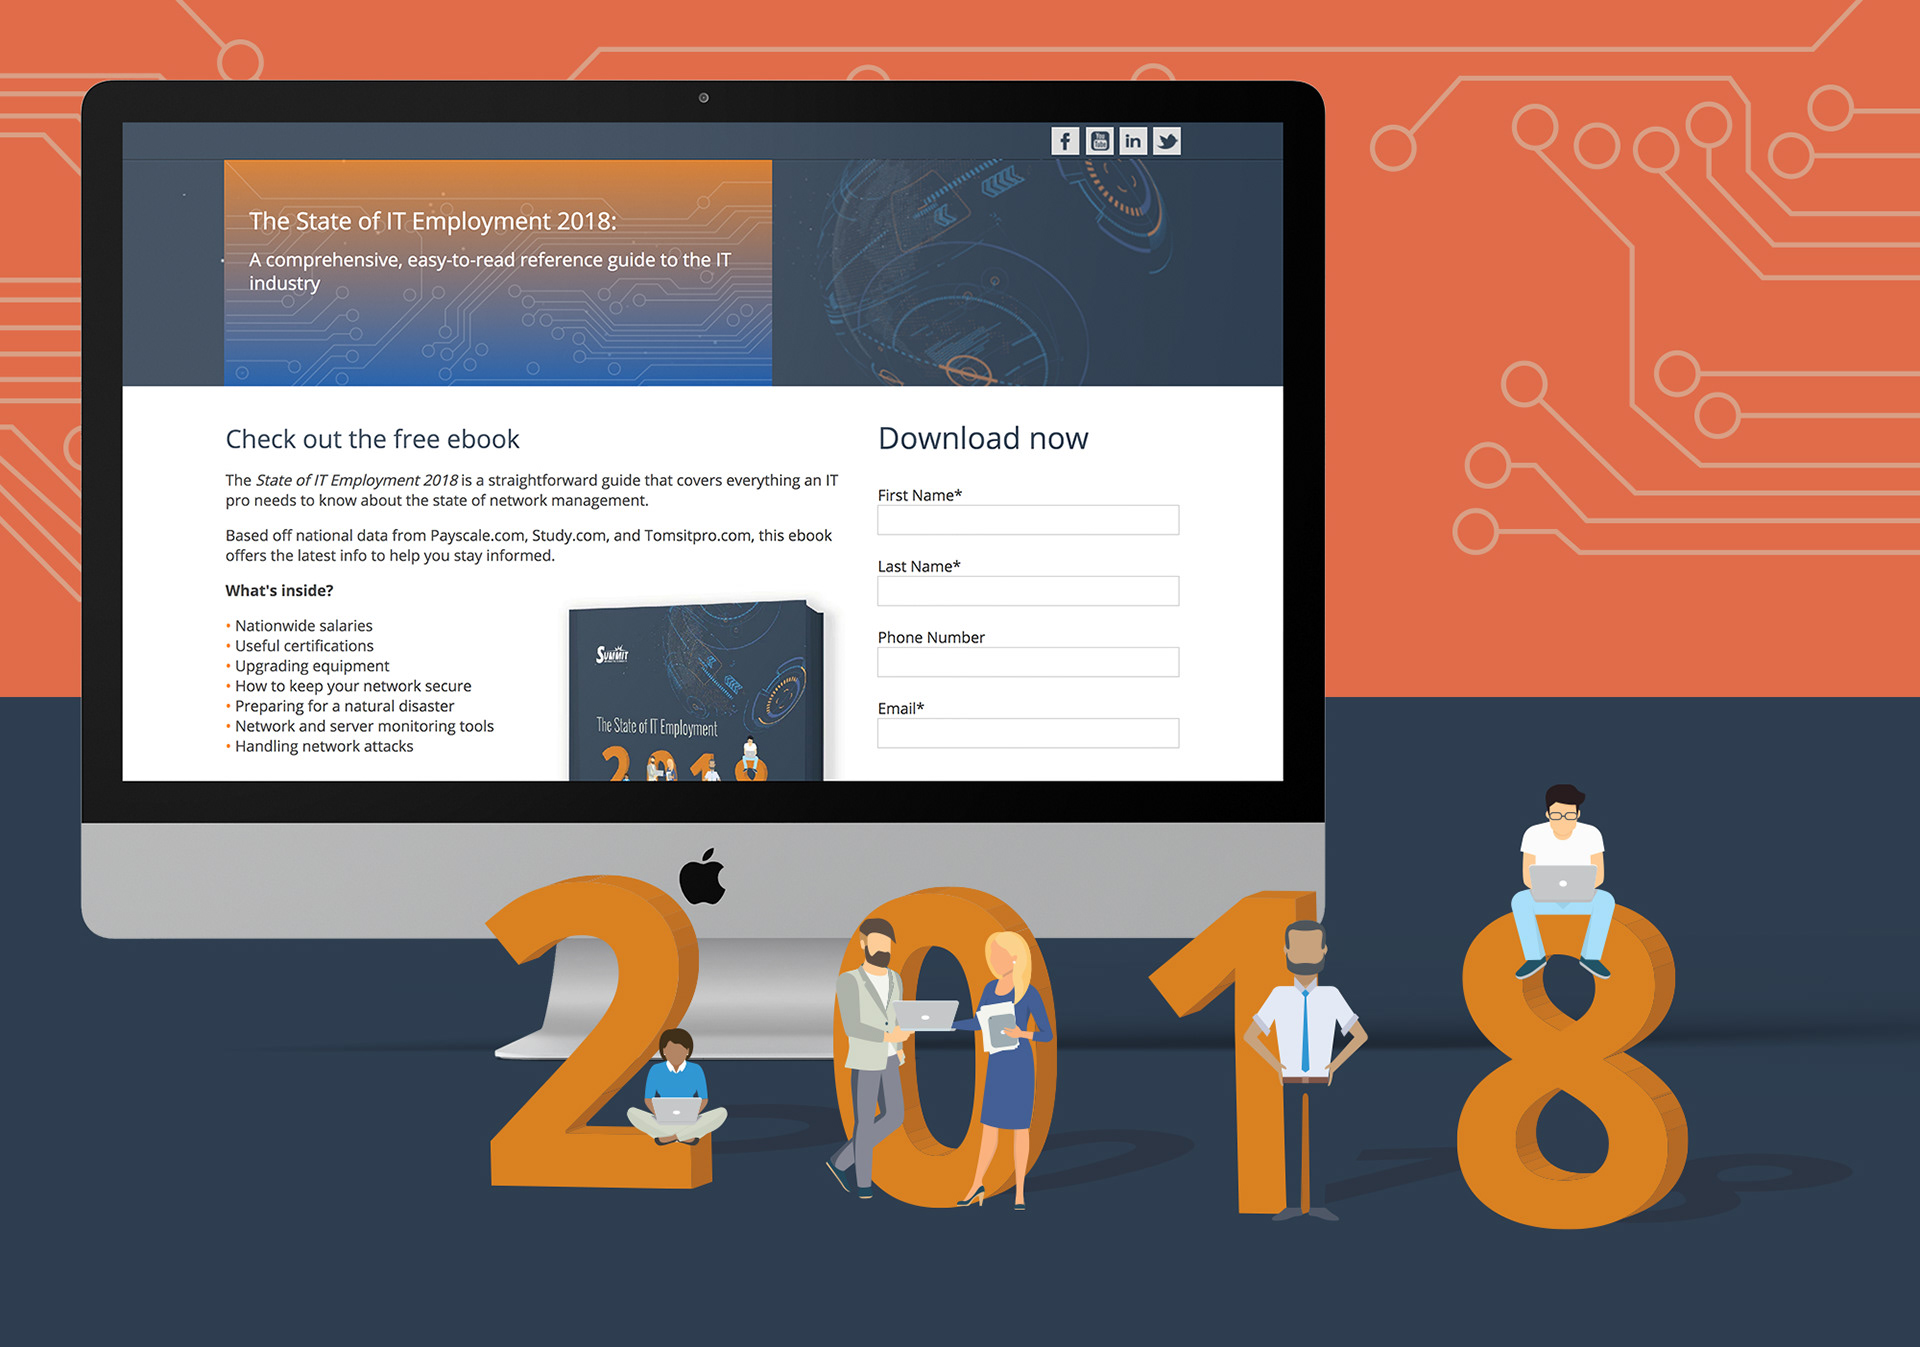
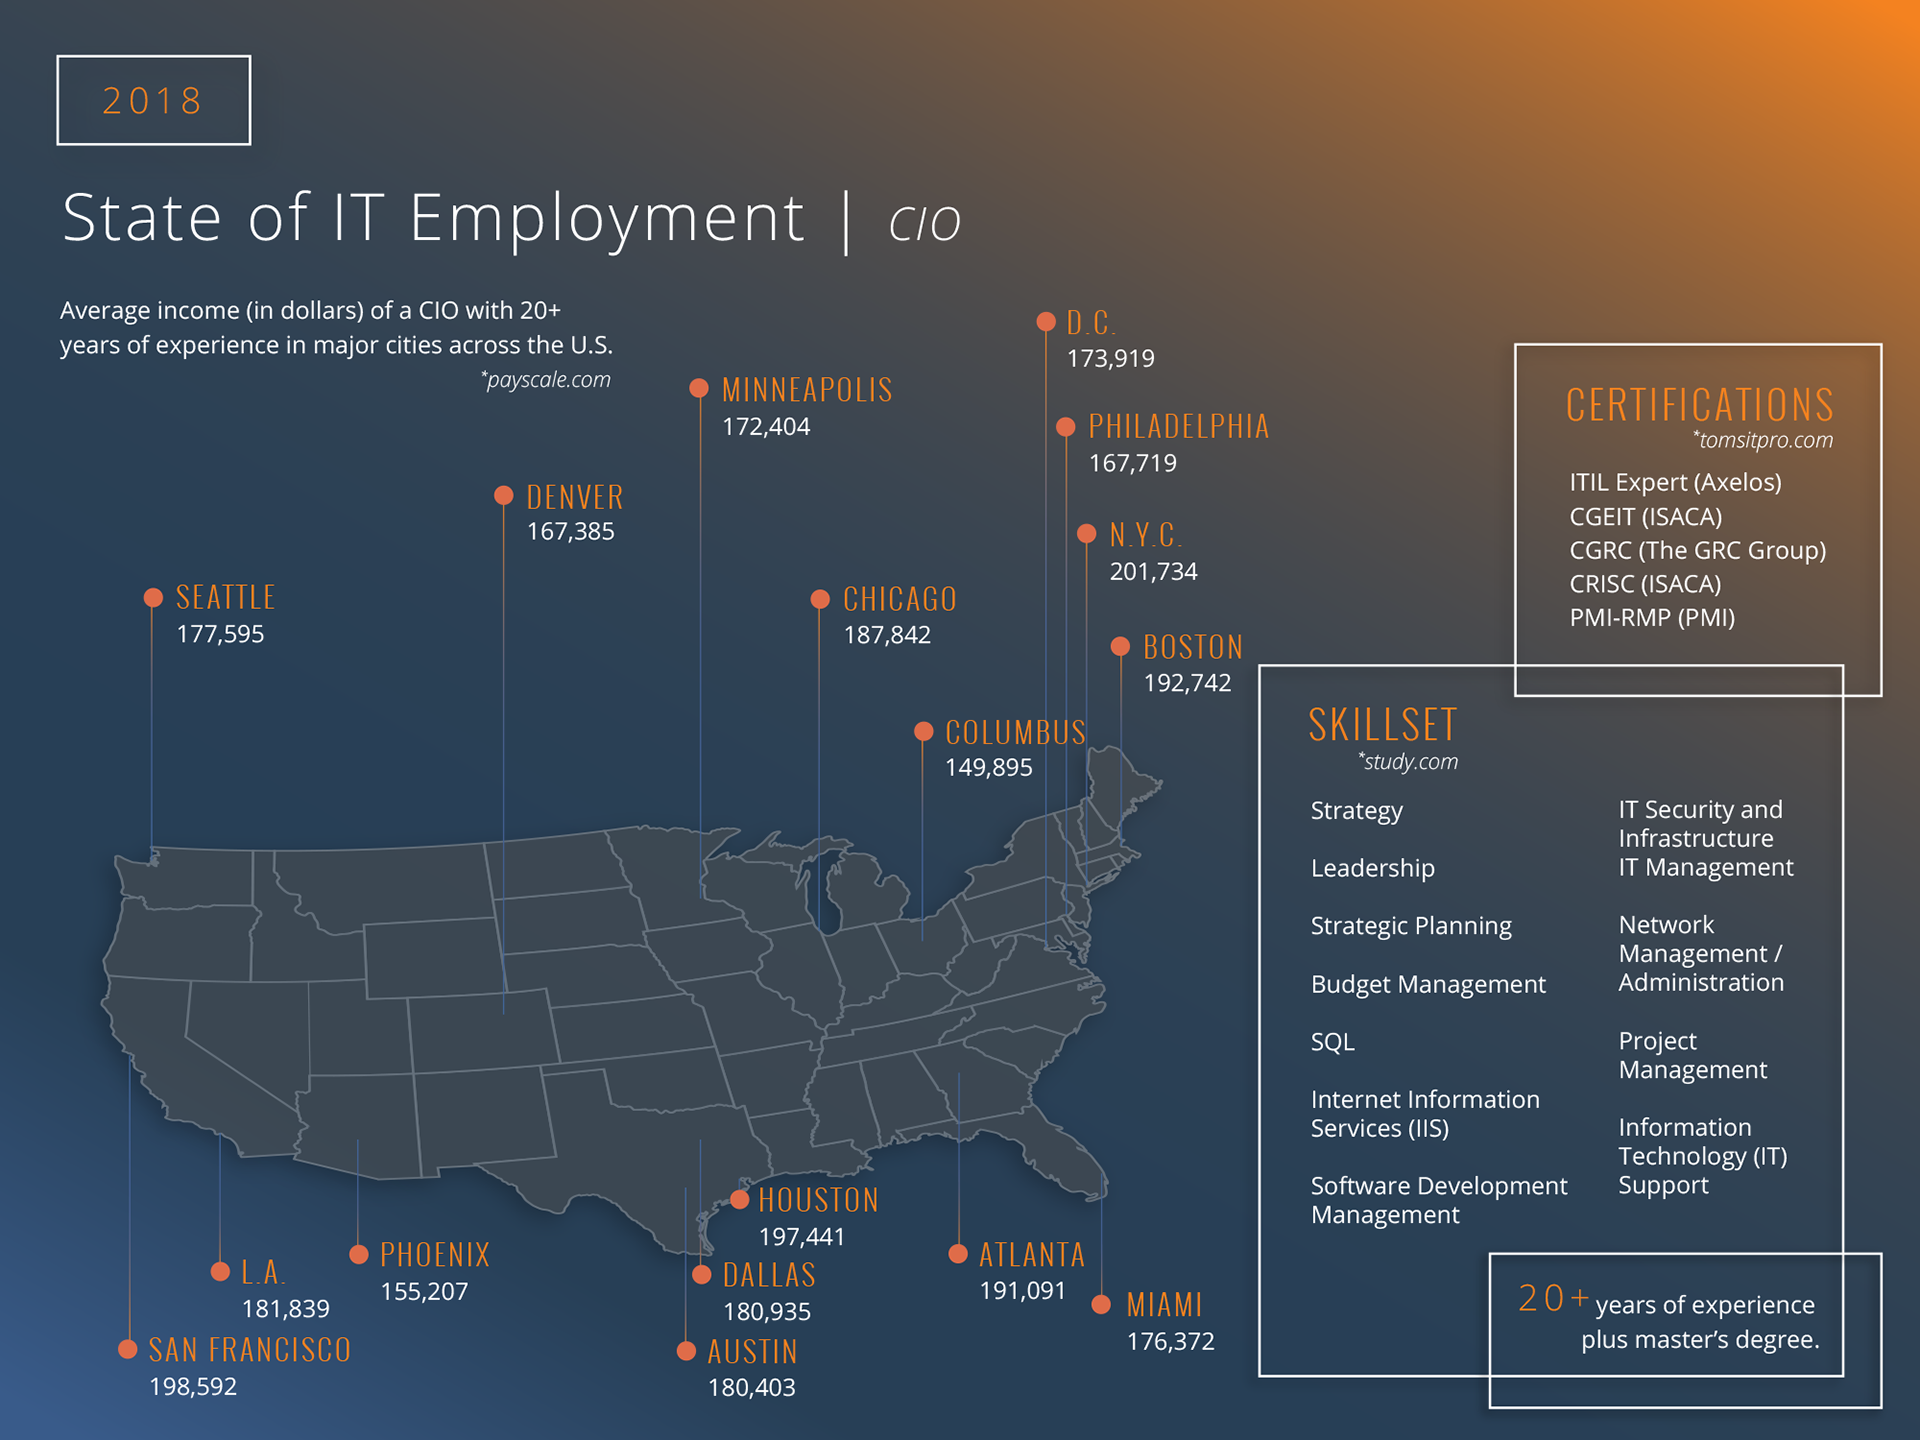
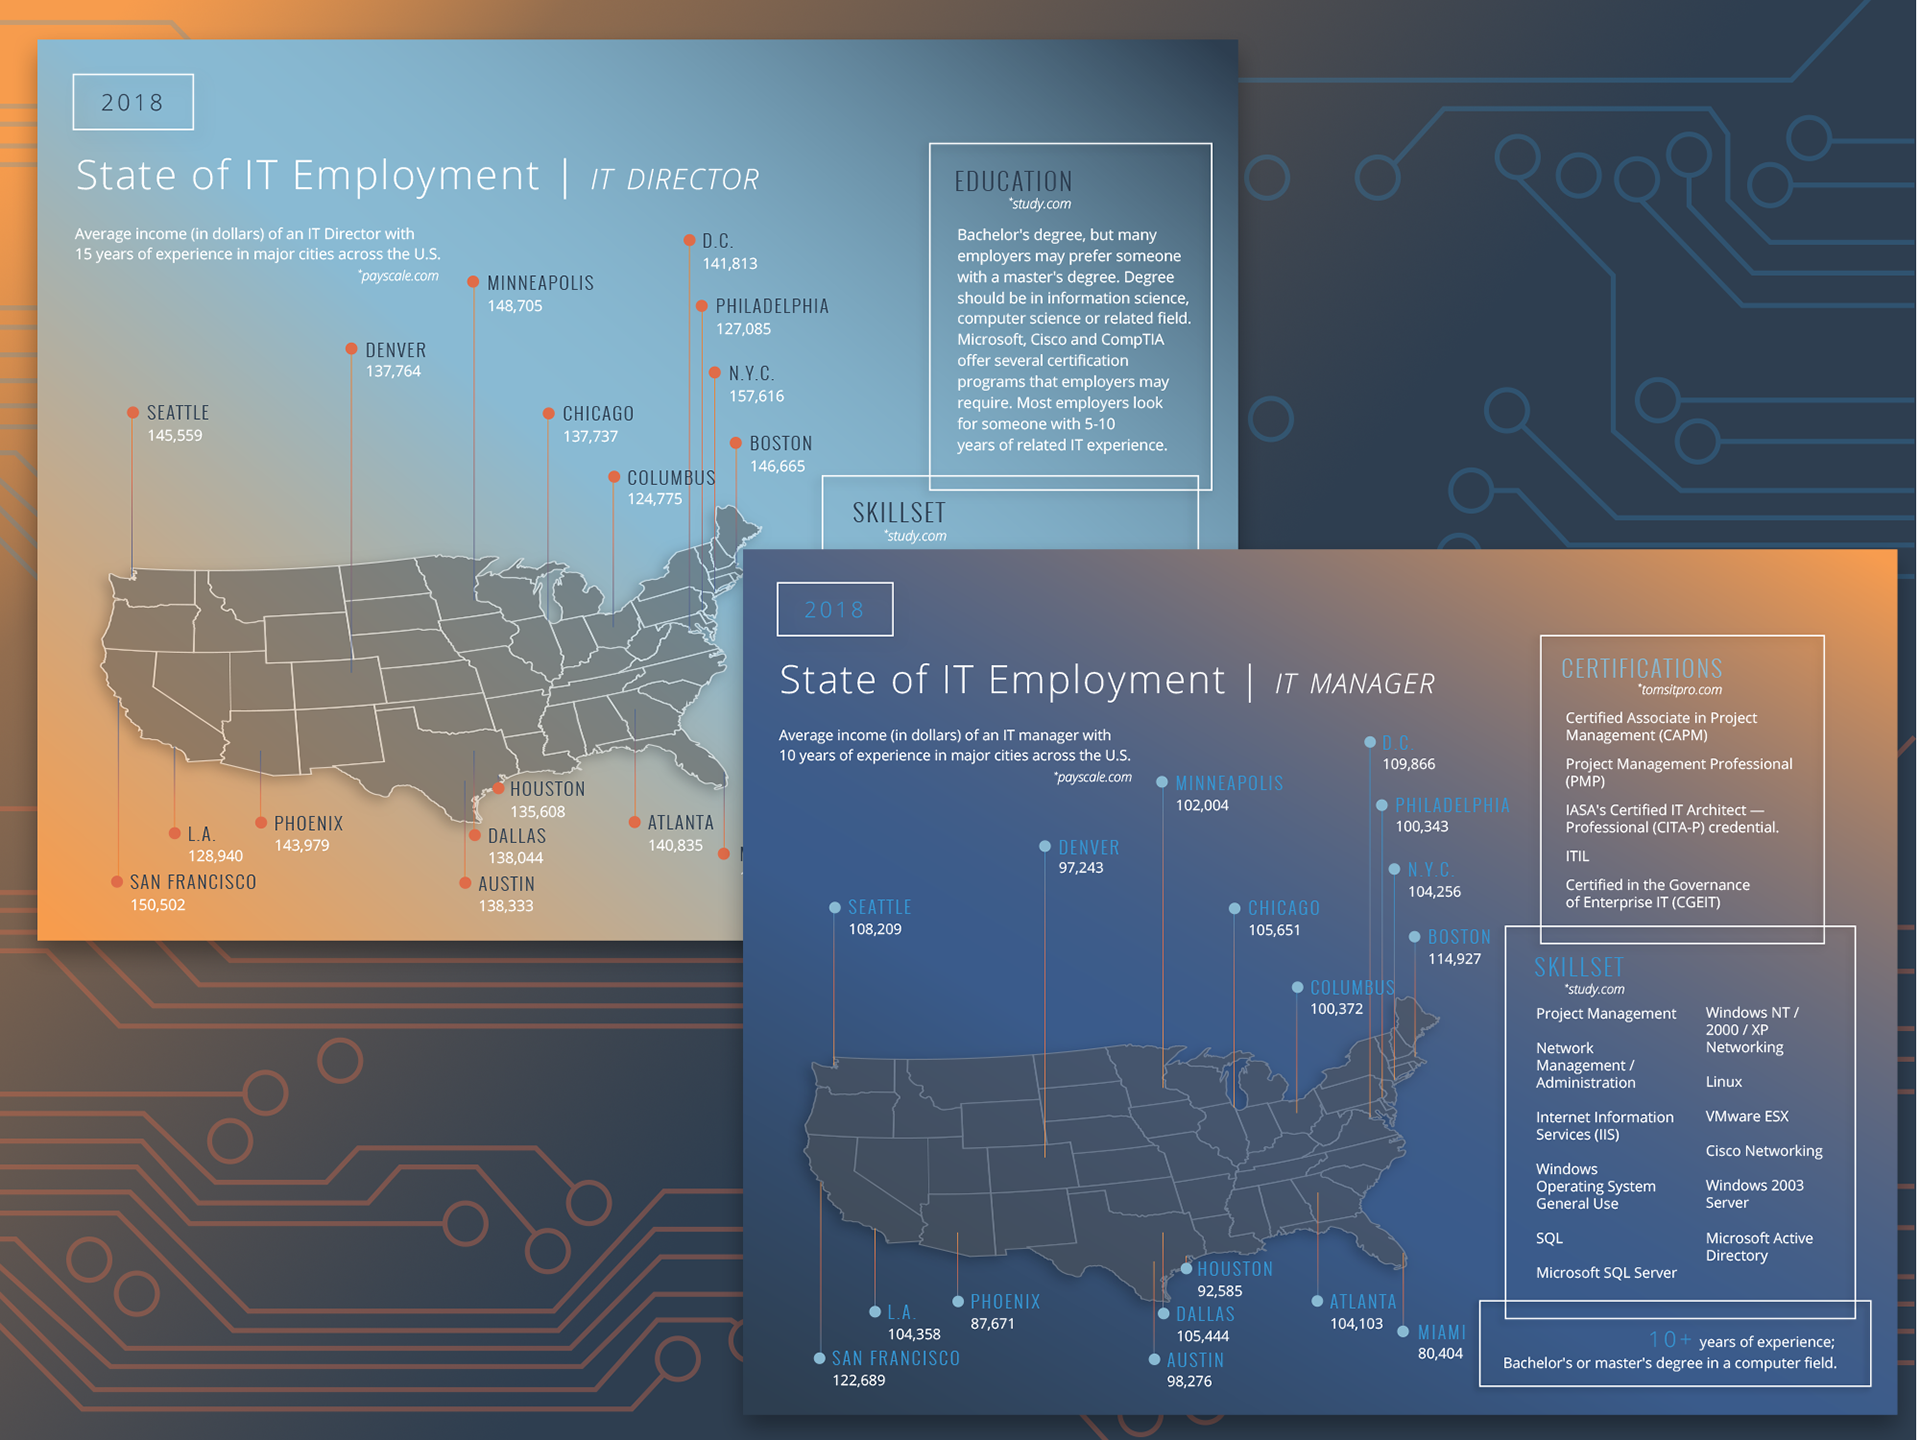
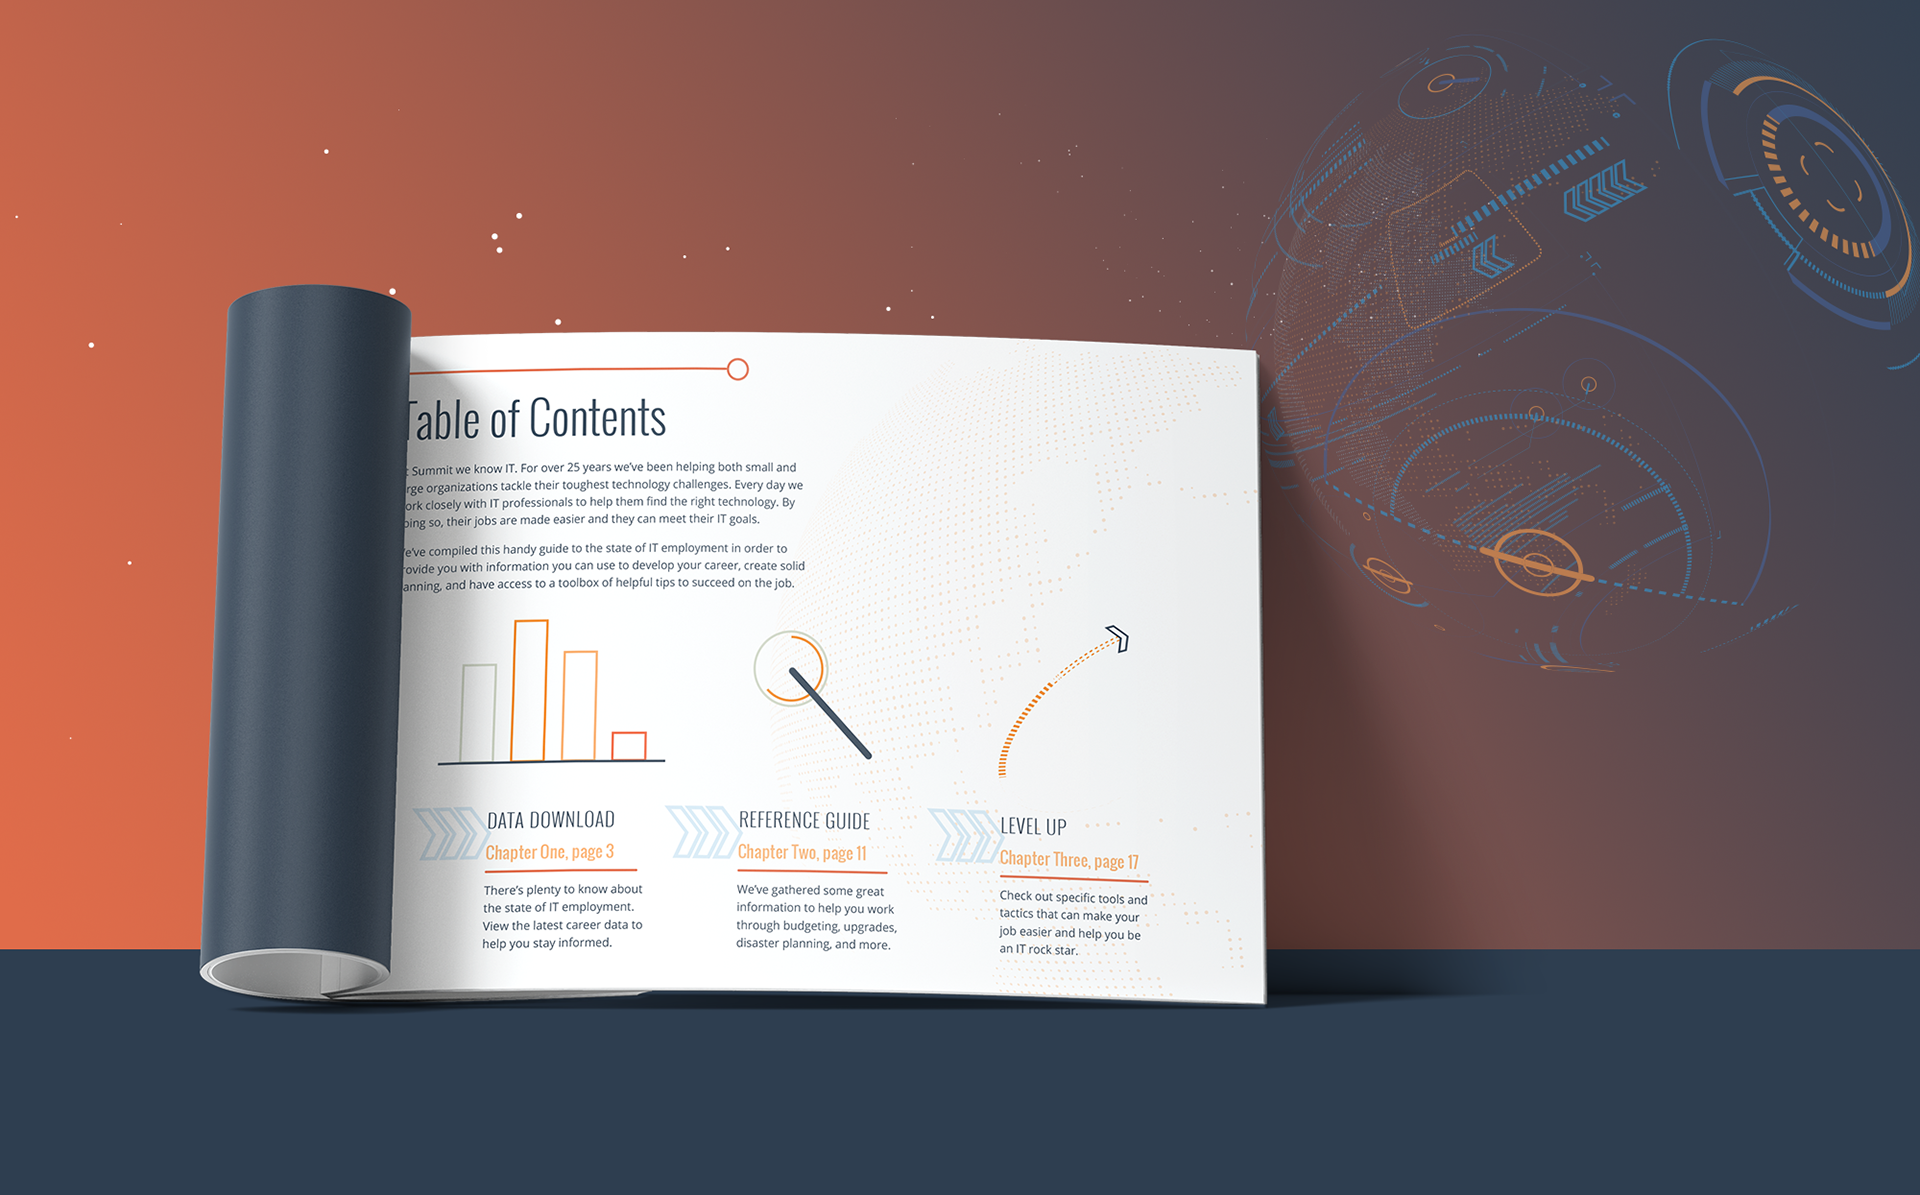
Each year, Summit does a thorough analysis to assess the state of the IT field and present it to their clients. This includes data to show average salaries in each state, average years of experience and other facts about each career. They needed individual infographics to map out each job title, all of which formed a united whole. They then wanted to take these graphics and create an ebook offer, with additional insight into the field of IT. The idea is that in seeing these graphics, clients, both existing and potential, will see Summit as an industry thought leader. Likewise, by enticing them to the gated ebook offer, they would receive new subscribers to their content. They also needed a design that reflected the changes the updates we were making to their brand.
approach
I looked at Feltron and other data-driven infographic designers to establish an aesthetic. To add more visual excitement, I implemented gradients both as a background factor and for the line work. I used bold typography yet regulated each choice to ensure it was organized and digestible. For the ebook, I included humanlike characters as a playful, human touch can be a unique sight in IT field. This went along with the ebook's focus on employees rather than product.
result
The product was 7 infographics and a 28-page infographic. This campaign has been one of their most successful yet, leading to a high number of conversions and therefore, several leads for their sales team. The client was thrilled with the direction I took with their design, advancing their brand to this brighter, upbeat aesthetic.